
The Teacher Guide Act 3: Analyze and Share
Act III of the MothEd Teacher Guide involves three phases: Analyze, Summarize, and Share. This act guides students through the final stages of the scientific process—making sense of their data, reflecting on what they’ve learned, and communicating their findings to others.
Phase 5: Analyze
LESSON 7: Graph It!
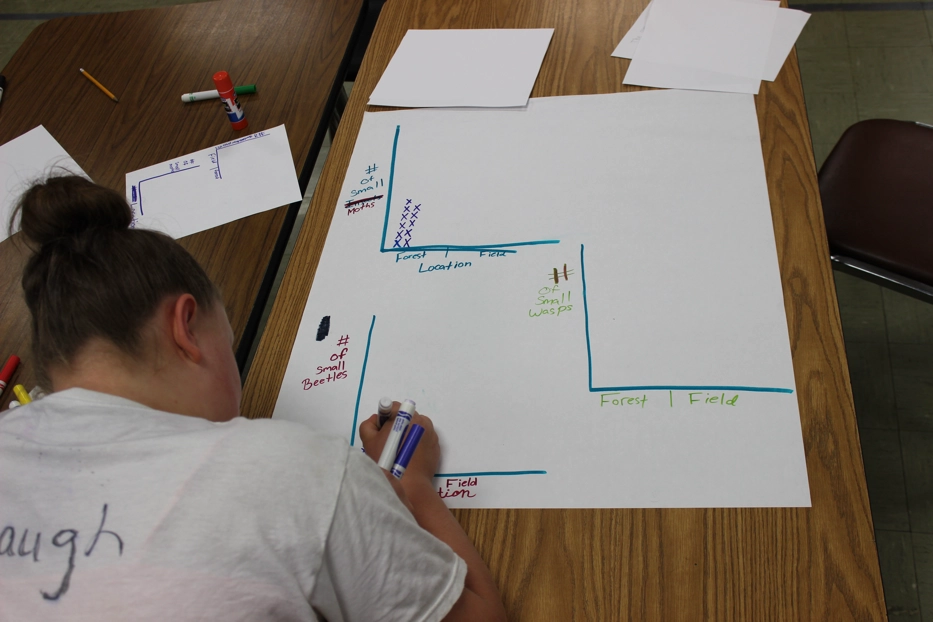
In the single lesson of this phase, Graph It!, students transform their raw data into meaningful insights by creating visualizations of their findings. After a quick refresher on summary statistics, students practice calculating key measures using both sample datasets and their own moth trap data. They then use these statistics to build graphical representations that highlight patterns and trends in their results.
Learning Outcomes:
By the end of this lesson, students will be able to:
- Generate and interpret summary statistics to describe patterns in collected data.
- Utilize graphing programs to create visual representations of their trapping data.
Activities:
Some of the activities in this lesson include:
- A refresher on summary statistics for students, accompanied by a short video and a slideshow with example graphs to help students review key concepts like mean, median, and mode. Students can practice calculating statistics using provided sample datasets.
- Students begin to explore the idea of representing their data visually, using graphs. Students can do this by hand, or through our online integrated MothEd Collaborative Learning User Environment (CLUE).
- Students are supported to interpret their results and to draw conclusions based on their data visualization and their knowledge of basic summary statistics.
Phase 6: Summarize
LESSON 8: Return to the Hypothesis!
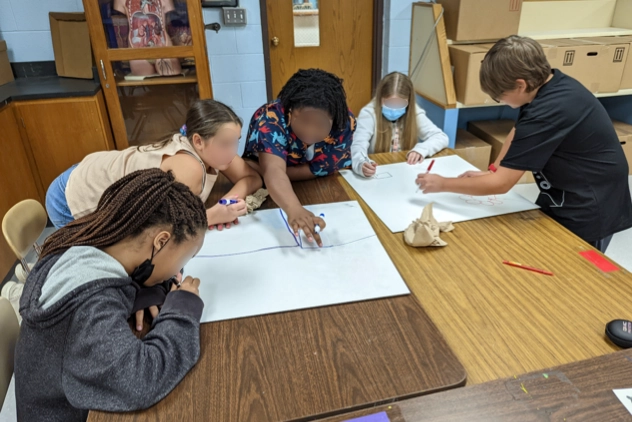
In the lesson of this phase, Return of the Hypothesis, students use their collected data and created visualizations to evaluate their original hypothesis. Drawing on summary statistics and graphs, they determine whether to accept or reject their hypotheses and reflect on the reasoning behind their conclusions. Students also consider how their experimental design influenced their results and brainstorm ways to refine future investigations for greater accuracy and insight.
Learning Outcomes:
By the end of this lesson, students will be able to:
- Use visualized data to draw conclusions and to accept or reject their original hypothesis.
- Reflect on their experimental process to identify factors that influenced their results
Activities:
Some of the activities in this lesson include:
- Teachers facilitate a class discussion, using a provided slideshow, to model whether to accept or reject a hypothesis based on data. This communal practice allows students to build confidence before they apply the process to their own investigations.
- Students then complete a provided worksheet to revisit their original hypotheses, provide rationale for their conclusions, and reflect on what they’ve learned about moths throughout their investigation.
- Using an experimental reflection tic-tac-toe worksheet, students respond to targeted prompts that allow them to evaluate the design and execution of their investigation, encouraging students to think critically about the strengths and limitations of their experiment.
- Students brainstorm next steps or potential modifications of their experiment to strengthen potential future investigations.
Phase 7: Share
LESSON 9: Present It!
In the final lesson, Present It!, students take center stage as scientists by presenting their experimental design, data, and conclusions to their peers. This collaborative sharing fosters active learning and peer-to-peer teaching, enhances scientific communication and literacy skills, and reinforces their role as authentic scientists in the classroom.
Learning Outcomes:
By the end of this lesson, students will be able to:
- Effectively communicate their scientific findings using appropriate visual, oral, or written formats.
- Engage in peer-to-peer learning by sharing and discussing experimental results.
Activities:
Some of the activities in this lesson include:
- Students identify the “big idea” from their experiment by answering the driving question: “What did you learn about moths from your experiment?”
- Students write their initial responses on a notecard and practice simplifying their findings into clear, concise statements. Students then share these “big ideas” with peers.
- Students are given time to plan and create their presentations, using a presentation format selected by the teacher. Whether through posters, slideshows, videos, or another format, students synthesize their investigations into presentations.